
One thing you’ll find in my work is a lot of references to K-Pop, pop culture and astrology. I firmly believe the best projects start with curiosity about things we genuinely love. For me, that means starting with what I know.
My journey into data began organically. While learning astrology, I naturally turned to spreadsheets to track planetary transits, log special dates, and identify patterns. It was a way to make sense of complex information. Then, a challenging question popped into my head that would become my first real attempt at hypothesis testing.
In astrology, there’s a process called Birth Time Rectification, which is all about figuring out someone’s rising sign without knowing their exact birth time. I knew the theory but had never tried it myself. I became curious: if I gathered enough public information about a person, could I use logic and deduction to find their ascendant? Even though I knew I might never get confirmation, this was just a fun experiment in pattern recognition.
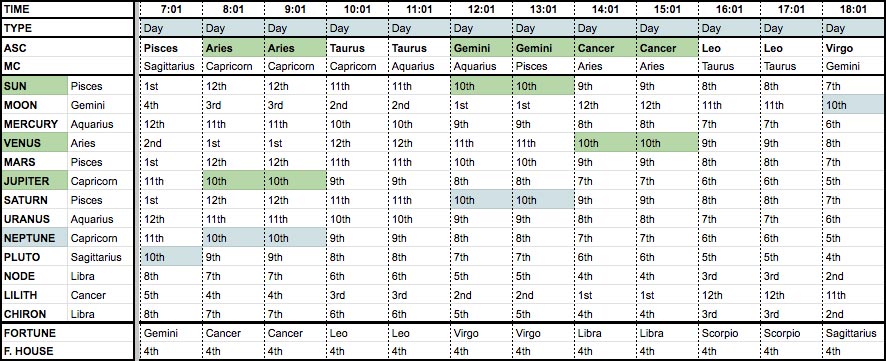
I started with the basics: my first goal was to determine if the artist had a “day chart” or a “night chart,” a crucial distinction that would immediately cut the possible options in half.
To do this, I began by creating my first table, segmenting all 24 possible ascendants into one-hour increments, this was my initial act of structuring the data into a testable model.
Next, I moved into identifying correlations by cross-referencing this new framework with key life events.
Drawing on astrological theory that day charts respond well to Saturn cycles, I noted that this artist began his solo career and received significant recognition during his Saturn return. This alignment became my first major data point correlation, serving as initial evidence toward the day chart hypothesis.
I then began filtering for significance, further refining the dataset by focusing only on ascendants that would place planets traditionally associated with fame and fortune, like the Sun, Venus, or Jupiter in prominent chart positions.
This process of systematically filtering and intuitively weighting the data points narrowed what began as two dozen possibilities down to just three strong candidate rising signs.
A good analyst always seeks a second opinion. To validate my hypothesis from another angle, I applied a technique called annual profections, which assigns specific themes to each year of life.
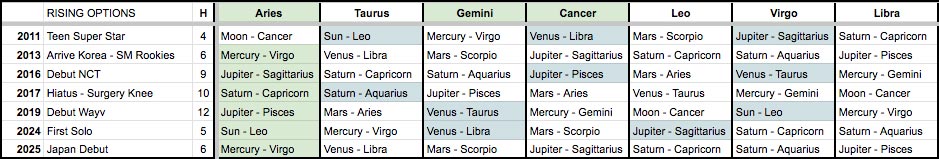
I built a timeline of the idol’s major events and cross-referenced each year with its corresponding profection. The results strongly supported one of the three candidate rising signs, providing a solid new confirmation of my initial findings.
At this point, I was nearly certain of the result. But I have a curious mind, I wanted one more layer of validation to feel truly confident. I needed to see if the data held up under a different light.
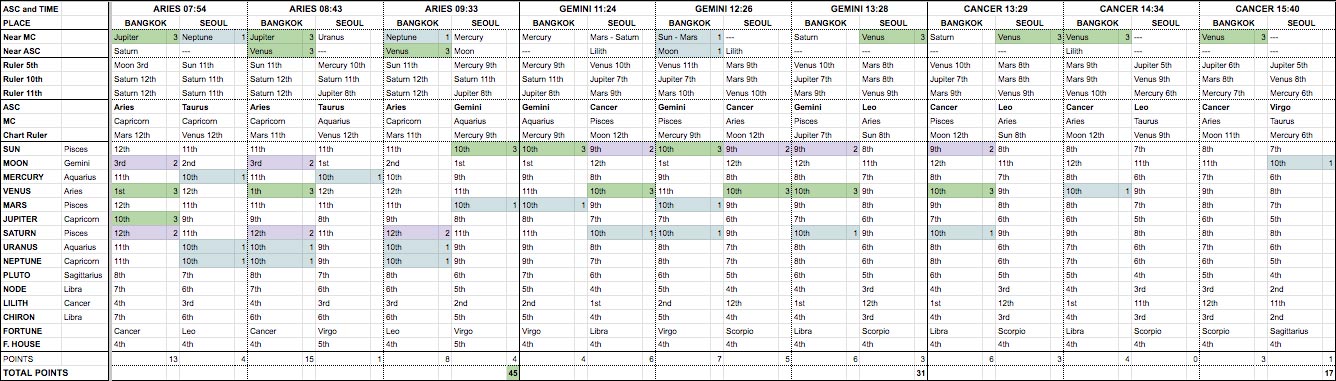
Knowing the artist was born in Thailand but achieved his fame in Korea, I turned to a technique called astrocartography. This meant generating three new relocation charts, one for each candidate rising sign, to see which one most strongly reflected the energy of his career success abroad. It was a fascinating geospatial analysis, and the results clearly confirmed my leading candidate.
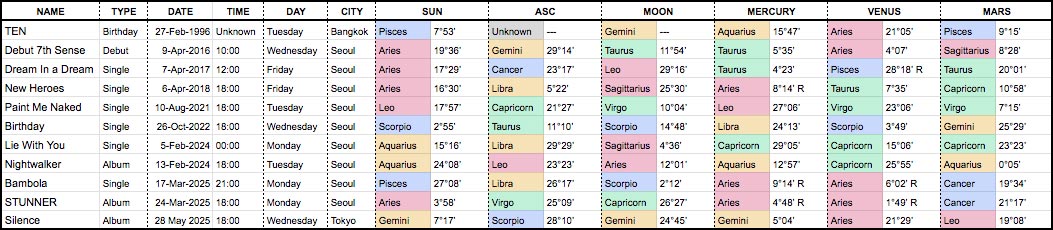
Still, I couldn’t resist a final, fun check. I decided to analyze the release charts for his entire solo discography. I created a new table with each song’s release date to see if a specific zodiac sign was dominant. To my genuine surprise, the zodiac sign associated with his suspected rising sign appeared with notable frequency.
It felt like the universe, or at least the data, was giving me a playful wink, adding a final piece of supporting evidence to the puzzle.
After applying four distinct analytical methods, chart segmentation, event correlation, timeline analysis, and geospatial mapping, they all pointed to the same conclusion.
While I may never know with 100% certainty if my conclusion is correct, that almost isn’t the point. This project was my first unconscious step into data analytics. It taught me how to:
Formulate a testable hypothesis from a simple question.
Structure, clean, and segment raw data into a workable format.
Apply multiple analytical models to test for consistency.
Correlate seemingly unrelated data points to find patterns.
Draw a data-driven conclusion based on the preponderance of evidence.
It was a powerful lesson: the core skills of analysis are the same, whether you’re working with planetary movements or sales figures. You just need curiosity and a structured approach. , pop


 path to a new career")