I’ve always been around code. From tweaking HTML and CSS to bring a design to life, to digging into PHP files to customize a WordPress theme, I understand how code works. I can read it, I can break it down, and I’ve even tried learning Python a few times. But if you ask me to write something complex from scratch? I’ll tell you the truth: I’m not an engineer. I don’t know code the way a developer does.
So, when I decided I wanted to create a notebook to showcase my K-pop astrology dataset, I felt that familiar hesitation. The kind that whispers, Maybe you shouldn’t because you don’t really know how.
But I’ve learned that waiting until you’re an expert means never starting at all.
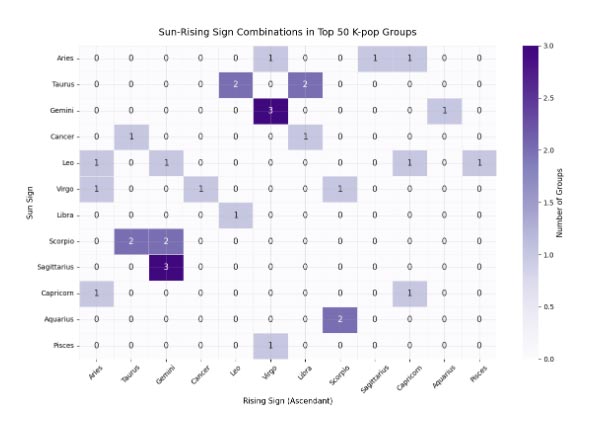
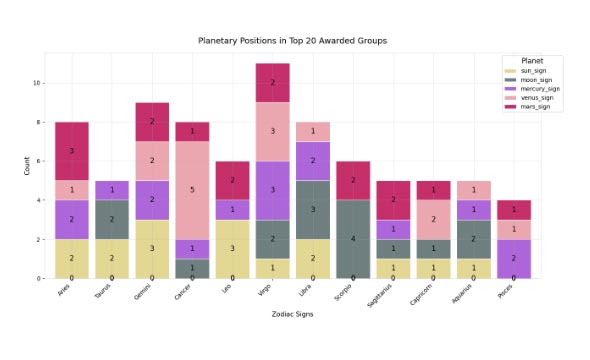
This project became my journey from basic code understanding to uncovering fascinating cosmic patterns in the data. My goal wasn’t to build the most technically advanced notebook. It was to tell a story. I wanted to use the notebook to highlight the astrological findings from my dataset, things like Sun and Moon sign patterns, generational planetary trends, and how elements or specific planetary placements might relate to a group’s success.
I started simple, using an AI assistant as my guide. I asked it how to write snippets in Python to run the analyses I envisioned: “How do I compare moon phases against physical sales numbers?” or “How can I chart the most common rising signs among top groups?” Because I already understood the logic of coding, I could not only use the AI’s suggestions but also refine them. I focused on making the code clean, coherent, and easy to follow, not just functional.
And of course, my designer instincts kicked in. It wasn’t enough for the visuals to just be accurate; they had to be clear and engaging. I spent time customizing the graphics, choosing color palettes that were harmonious, ensuring labels were legible, and creating a layout that felt intentional. A well-presented insight is a more compelling insight.
Slowly, it all came together. The notebook began to reveal the patterns I was curious about, visualizing the connections I had hypothesized.
The notebook did its job: it made my data and my findings, on everything from company patterns to awards and moon phases, visual and engaging. It proved that you don’t need to be an expert coder to start doing data analysis. You need curiosity, a clear goal, and the willingness to use the tools available to build your vision.
I built a notebook. It has code in it, yes. But more importantly, it has my voice, my questions, and my discoveries. And I’m proud of that.