
What astrology taught me about data Blog October 7, 2025 arlain For a very long time, I was very shy about my work in astrology, especially when talking with people from other industries like engineering and design. In my experience, when I mentioned astrology to people from those fields, they were dismissive. Sometimes they even mocked it, so I decided to stop talking about it. I started erasing that entire part of my knowledge and experience from my portfolio and resume. It left me with this sensation that I hadn’t accomplished anything in my life. But then, recently, I just said to myself: you know what? I am this person. I have a background in web design and social media, and I understand code (well, HTML and CSS, but you know what I mean). But I also spent an important part of my life on this other, more holistic path, one that is less fixed, less “rational,” but not for that, any less important. Finding the Pattern in the Chaos That’s how I started to see two things clearly. First, I’m an astrology cliché with a Midheaven in Aquarius, which means I’m here to combine knowledge in ways nobody has before. And second, astrology has already taught me invaluable lessons for my new path in data. As I mentioned in other articles, one of the first things I did when I started studying astrology was create a spreadsheet of all the important transits in my life. I found a date or two that were so precise, lining up perfectly with major events. So, I started tracking everything. Because that’s a core part of astrology: tracking events and then cross-referencing them with astrological patterns. It’s an investigative process. You gather information from the past to understand how things might manifest in the present or future. The Data Point That Changed Everything In this exercise of tracking my own transits, I found that when my son was born, there was an exact Saturn transit. Saturn governs responsibility, structure, and parenthood. And that transit was activating my 5th house (the house associated with children). I was blown away. But I’m sure I never would have found that connection if I hadn’t created that first spreadsheet. That initial spreadsheet was also my first lesson in data cleaning. Not every event fit neatly into a category. I had to make judgment calls, create consistent labels for different types of life events (like ‘career change,’ ‘relationship beginning,’ ‘personal loss’), and decide what was a major transit versus a minor one. It was messy, human data, and astrology gave me a framework to standardize it. This is no different from preparing a business dataset, where you have to clean customer information or sales categories to find clear patterns. The Pattern Continues I think astrology is a fantastic tool for understanding patterns and even for organizing information. It’s something tangible; you can calculate things. Some cycles have specific timeframes, and analyzing that data can reveal what might be on the horizon or what a possible outcome could look like. Of course, astrology is not a precise science, it has an intuitive, symbolic layer to it. But it definitely has a part where you can merge this knowledge with the skills used in the data field. It’s also interesting how astrology, when you do it properly with all the study it requires, helps build the mindset of a curious investigator. If you’re already a curious person, you’ll definitely find yourself going down rabbit holes that help you find patterns and draw fascinating conclusions about your own life. At the end of the day, I still check those transits. I still see how they line up with my life, and I’m still learning from them. Now that my son is older, I can look back and see the astrology of his path and mine with even more clarity, watching how the patterns we started with continue to unfold in our lives. It’s the most personal dataset I’ve ever analyzed, and it’s the one that taught me to never be ashamed of how I see the world. Mlife Builder Read More My (not-so-straight) path to a new career Read More Astro Alpha Read More

Building my first data notebook
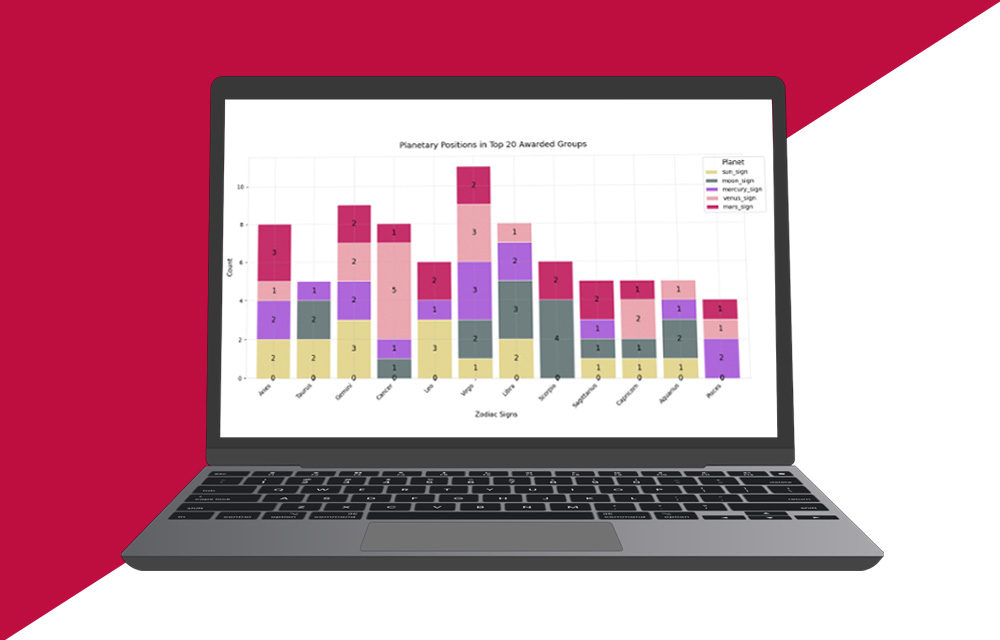
Building my first data notebook Blog September 20, 2025 arlain I’ve always been around code. From tweaking HTML and CSS to bring a design to life, to digging into PHP files to customize a WordPress theme, I understand how code works. I can read it, I can break it down, and I’ve even tried learning Python a few times. But if you ask me to write something complex from scratch? I’ll tell you the truth: I’m not an engineer. I don’t know code the way a developer does. So, when I decided I wanted to create a notebook to showcase my K-pop astrology dataset, I felt that familiar hesitation. The kind that whispers, Maybe you shouldn’t because you don’t really know how. But I’ve learned that waiting until you’re an expert means never starting at all. From Code Curiosity to Cosmic Patterns This project became my journey from basic code understanding to uncovering fascinating cosmic patterns in the data. My goal wasn’t to build the most technically advanced notebook. It was to tell a story. I wanted to use the notebook to highlight the astrological findings from my dataset, things like Sun and Moon sign patterns, generational planetary trends, and how elements or specific planetary placements might relate to a group’s success. I started simple, using an AI assistant as my guide. I asked it how to write snippets in Python to run the analyses I envisioned: “How do I compare moon phases against physical sales numbers?” or “How can I chart the most common rising signs among top groups?” Because I already understood the logic of coding, I could not only use the AI’s suggestions but also refine them. I focused on making the code clean, coherent, and easy to follow, not just functional. And of course, my designer instincts kicked in. It wasn’t enough for the visuals to just be accurate; they had to be clear and engaging. I spent time customizing the graphics, choosing color palettes that were harmonious, ensuring labels were legible, and creating a layout that felt intentional. A well-presented insight is a more compelling insight. Slowly, it all came together. The notebook began to reveal the patterns I was curious about, visualizing the connections I had hypothesized. The notebook did its job: it made my data and my findings, on everything from company patterns to awards and moon phases, visual and engaging. It proved that you don’t need to be an expert coder to start doing data analysis. You need curiosity, a clear goal, and the willingness to use the tools available to build your vision. I built a notebook. It has code in it, yes. But more importantly, it has my voice, my questions, and my discoveries. And I’m proud of that. My (not-so-straight) path to a new career Read More Orozco Legal Read More Despensa de la Sierra Read More
Kpop Astro Dataset
KPOP ASTRO DATASET Year: 2025Category: DataURL: kaggle Project: This dataset contains information about some of the most relevant Kpop groups, the idea is to see their success in metrics like PAKs and awards to cross them with astrological information from their debut dates. Kpop_astro_dataset_01 Kpop_astro_dataset_02 Kpop_astro_dataset_03 Back to Portfolio

From personal curiosity to public dataset
From personal curiosity to public dataset Blog September 19, 2025 arlain When I look back at this, my first dataset, I’ll probably cringe and think about all the “bad things” I did while creating it. But there’s also something beautiful in the naivety of working on something for the first time. You don’t have the experience to judge yourself too harshly, you come with a beginner’s mind, and that’s something valuable. I had just started my first course in Data Analysis (the basics, you know) and they suggested we work on a project for our portfolio. Even though I knew I wanted to work with something familiar, I wasn’t sure what to do or how to tackle it. Then I thought, okay, I have to keep it simple. I don’t want to overcomplicate things. I’m learning; this is a new field for me. Even though I have some background, I didn’t want to pressure myself. That’s how I landed on this idea: create a dataset and share it publicly (in case people wanted to give feedback), and make it about something I love. So, logically, the first thing that popped into my mind was to work with astrology and K-pop. Where astrology meets data: my first K-Pop dataset I already had a project where I’d compiled a huge spreadsheet with astrological info for over 400 idols. It started as an exercise for me, then became a website. But life happened and I didn’t have time to maintain the site, so I decided to close it. I thought maybe it was a good time to revive it, but it felt like a huge task. In the end, I decided to do something simpler. I already had information on many groups and their debuts; all I had to do was structure it into a clean dataset and add the astrological details. At first, I wasn’t familiar with dataset standards, how to name columns, format dates, handle numbers, etc. But as I learned more, I decided it was the perfect time to take all that information and organize it the “right” way. Learning to structure my Data In my first attempt, I thought about making both a light and a complete version of the dataset. But once I started filling in the information and deciding what was relevant and what wasn’t, I realized it was cleaner to just have one version. I initially included a lot of data that felt valuable but didn’t add much in the end. For example, to get the exact debut time for the astrological charts, I pulled metadata from YouTube videos. For older groups without a YouTube debut, I had to leave it blank. At first, I included the actual YouTube links, but I realized that was unnecessary. In the final version, I simplified it to a single column that simply indicates whether the time data is reliable or not. This made the dataset cleaner and more focused on what truly mattered for analysis. I also included less relevant info early on, like the group’s Korean name, something that I get rid off too. But one thing I almost left out turned out to be important: whether a planet was retrograde or not. From an astrological perspective, that can add meaningful layers to the analysis. In the end, I ended up with a 23.73 kB dataset with 27 columns and 120 groups. I know, it doesn’t sound simple, but I tried my best to clean it and keep what was relevant for future use. What made the cut and what didn’t This exercise taught me a lot about data gathering. I used sites like Kpopping and SoriData to collect group info: names, debut dates, companies, group type, status, and success markers like PAKs, music show wins, year-end awards, physical sales, and organic YouTube views. Once I had the debut date, I extracted metadata from YouTube videos to get the exact debut time (when available), then calculated all the astrological details with astro-seek: sun sign, moon sign, rising sign, and planetary positions. This gave me a rich dataset that can be used for multiple purposes. You can cross-reference debut dates, group success, and astrological data to find patterns. That was actually the second step of this project, but I’ll save that for another article. Through this simple exercise, I learned a lot and I also got over the shyness of sharing something that reveals my interests, even while I’m still learning. The funny thing is, I thought no one would care about a dataset like this. Astrology and K-pop? Really? But to my surprise, even though it’s not one of those famous downloaded datasets, people actually engaged with it. I thought maybe three people would see it. But as of today, the dataset has 2,811 views, was downloaded 412 times, and, most exciting, someone other than me created a notebook using the data. This experience reminded me that passion projects are worth sharing, even if they feel niche or imperfect. You never know who might find it useful, interesting, or inspiring. What began as a simple learning exercise became a small but meaningful contribution to a community I care about. And that alone made every hour spent on it worthwhile. How a simple question led me down a data rabbit hole Read More Cuatro Lunas Read More Kanji Read More

How a simple question led me down a data rabbit hole
How a simple question led me down a data rabbit hole Blog September 18, 2025 arlain One thing you’ll find in my work is a lot of references to K-Pop, pop culture and astrology. I firmly believe the best projects start with curiosity about things we genuinely love. For me, that means starting with what I know. My journey into data began organically. While learning astrology, I naturally turned to spreadsheets to track planetary transits, log special dates, and identify patterns. It was a way to make sense of complex information. Then, a challenging question popped into my head that would become my first real attempt at hypothesis testing. In astrology, there’s a process called Birth Time Rectification, which is all about figuring out someone’s rising sign without knowing their exact birth time. I knew the theory but had never tried it myself. I became curious: if I gathered enough public information about a person, could I use logic and deduction to find their ascendant? Even though I knew I might never get confirmation, this was just a fun experiment in pattern recognition. The Process: A Methodical Deep Dive I started with the basics: my first goal was to determine if the artist had a “day chart” or a “night chart,” a crucial distinction that would immediately cut the possible options in half. To do this, I began by creating my first table, segmenting all 24 possible ascendants into one-hour increments, this was my initial act of structuring the data into a testable model. Next, I moved into identifying correlations by cross-referencing this new framework with key life events. Drawing on astrological theory that day charts respond well to Saturn cycles, I noted that this artist began his solo career and received significant recognition during his Saturn return. This alignment became my first major data point correlation, serving as initial evidence toward the day chart hypothesis. I then began filtering for significance, further refining the dataset by focusing only on ascendants that would place planets traditionally associated with fame and fortune, like the Sun, Venus, or Jupiter in prominent chart positions. This process of systematically filtering and intuitively weighting the data points narrowed what began as two dozen possibilities down to just three strong candidate rising signs. Refining the Model with Additional Datasets A good analyst always seeks a second opinion. To validate my hypothesis from another angle, I applied a technique called annual profections, which assigns specific themes to each year of life. I built a timeline of the idol’s major events and cross-referenced each year with its corresponding profection. The results strongly supported one of the three candidate rising signs, providing a solid new confirmation of my initial findings. Validation and concluding At this point, I was nearly certain of the result. But I have a curious mind, I wanted one more layer of validation to feel truly confident. I needed to see if the data held up under a different light. Knowing the artist was born in Thailand but achieved his fame in Korea, I turned to a technique called astrocartography. This meant generating three new relocation charts, one for each candidate rising sign, to see which one most strongly reflected the energy of his career success abroad. It was a fascinating geospatial analysis, and the results clearly confirmed my leading candidate. Still, I couldn’t resist a final, fun check. I decided to analyze the release charts for his entire solo discography. I created a new table with each song’s release date to see if a specific zodiac sign was dominant. To my genuine surprise, the zodiac sign associated with his suspected rising sign appeared with notable frequency. It felt like the universe, or at least the data, was giving me a playful wink, adding a final piece of supporting evidence to the puzzle. Conclusion: The Data Doesn’t Lie After applying four distinct analytical methods, chart segmentation, event correlation, timeline analysis, and geospatial mapping, they all pointed to the same conclusion. While I may never know with 100% certainty if my conclusion is correct, that almost isn’t the point. This project was my first unconscious step into data analytics. It taught me how to: Formulate a testable hypothesis from a simple question. Structure, clean, and segment raw data into a workable format. Apply multiple analytical models to test for consistency. Correlate seemingly unrelated data points to find patterns. Draw a data-driven conclusion based on the preponderance of evidence. It was a powerful lesson: the core skills of analysis are the same, whether you’re working with planetary movements or sales figures. You just need curiosity and a structured approach. , pop Kokeshi Tarot Read More Orozco Legal Read More Foodiesposos Read More

My (not-so-straight) path to a new career
My (not-so-straight) path to a new career Blog September 17, 2025 arlain Sometimes you think you know what you want in life. Sometimes you take a path and think, “This is it. I can do this forever.” But for some of us, the path isn’t a straight line. It’s full of twists and turns. We move between different interests, collect all sorts of knowledge, and end up doing a million things that somehow, eventually, connect. My first dream was to study psychology. (And honestly, years later, I still think I have what it takes to be good at it, but that’s a story for a different timeline in the multiverse!) But family guidance steered me in a different direction, so I ended up with a degree in Industrial Design. Looking back, I’m incredibly grateful for the skills I learned. But I also look at that decision now and think, “Wow, how did I ever think that was the right fit for me?!” The result? A diploma for a career I never actually practiced. And that’s okay! It taught me invaluable lessons and, more importantly, led me directly to my next stop: Web Design and Social Media. I’m deeply thankful for that chapter. I met amazing people, took on tons of projects, and built a real career. But once again, I had this nagging feeling that I hadn’t quite found “my thing.” So many paths, so many interest… And here’s the thing about me: I’ve always had two sides. One is logical and precise, it feels at home with structured systems, clean code, and stable data, but the other is creative, intuitive, and constantly searching for deeper meaning. This duality lets me see the world through different lenses, but it also explains my wonderfully crooked career path. While building websites and running email campaigns, I gave myself permission to explore a completely different passion: Traditional Chinese Medicine and the esoteric world. This wasn’t a random hobby; it’s been an essential part of my life since I was a child. Life has a funny way of connecting the dots. I found a strange and perfect balance by taking on very precise, technical WordPress support work. This stability gave me the freedom to dive into my other interests, and I launched an Astrology and Tarot project, using all my design and social media skills. It started slowly, then gained incredible traction during the pandemic. People were curious and had time to explore. I created courses, offered consultations, and built a fulfilling practice that supported me. And finally, when I think I achieve the desired balance the world shifted again. As life returned to “normal,” personal challenges arose, and maintaining momentum became harder. While this work was the most satisfying I’d ever done, I found it difficult to sustain the focus and consistency required, especially when dealing with the unfamiliar parts of running a business. Then, my stable WordPress revenue stream dried up. Suddenly, life presented me with a big question: “What’s next?” Starting over? And that’s where data analytics enters the picture. I know it might seem like a leap, but to me, it’s the most logical step I could take. When I learned astrology, I didn’t just memorize meanings, I built massive spreadsheets. I tracked dates, planetary movements, and life events, uncovering incredible patterns (like the beautiful coincidences surrounding my son’s birth). This analytical approach isn’t entirely new. My years in web design have already familiarized me with the logic of code, and working extensively with WordPress gave me a practical understanding of how databases are structured and managed. I’ve always been drawn to that intersection of logic and creativity. Building on that foundation, I began applying this same structured thinking to my personal interests. I once created a website housing a database of over 400 K-pop artists’ astrological charts, a project I’m eager to rebuild. More recently, I compiled, cleaned, and published a completely different dataset on Kaggle, tracking debut dates and company information across the K-pop industry. That process of curating, cleaning, and analyzing data to find the story hidden within it was my real training. Without realizing it, I was building the foundational skills of a data analyst; I just happened to be using planets and debut dates. And of course, all of these projects, right down to the notebooks I created for my datasets, were infused with my designer’s eye. For me, clear and thoughtful visualization isn’t an afterthought; it’s an essential part of making data understandable and compelling. So, here I am. I’m embarking on this new path in data, armed with all the skills from my zigzag journey. I’m documenting the road to see where it takes me. Who knows? Maybe all those crooked lines were leading me right here all along. Foodiesposos Read More And Now What Read More How a simple question led me down a data rabbit hole Read More

Blissful Aquarius
BLISSFUL AQUARIUS Year: 2024Category: Social MediaClient: Blissful AquariusURL: youtube.com/@BlissfulAquarius Project Scope: This is a YouTube channel dedicated to meditation music. For this project, I have been creating the visual elements, the animations for the music, the thumbnails, and also the shorts that promote each video. 20BlissfulAquarius01 20BlissfulAquarius02 20BlissfulAquarius03 Back to Portfolio

Foodiesposos
FOODIESPOSOS REELS Year: 2023 – presentCategory: Social MediaClient: FoodiespososURL: Social Media Foodiesposos Project: For this project I edited the latest reels for a foodie account,, selecting the videos, images and adding the information. Those reels are for Instagram and TikTok. 19Foodiesposos01 19Foodiesposos02 19Foodiesposos03 Back to Portfolio

Kanji
KANJI APP Year: 2023Category: AppClient: Proposal for incoming project Project scope: I designed the app’s color palette, icons, and the main interface, and also contributed to improving the app’s flow to enhance the user experience. App Kanji App Kanji App Kanji Back to Portfolio

Alo Fusion
ALO FUSION Year: 2023Category: Web – WordPressClient: Alo Asian Kitchen Project scope: This project involved a complete WordPress installation and customization of the WordPress theme. I added all the content and made modifications to numerous pages to fully customize the entire website. Alo Fusion Alo Fusion Alo Fusion Back to Portfolio